
Environmental Data System
At the heart, the environmental data system is a database that collects metrics from across IT & data center infrastructure, enriches it using external data, e.g. on the emissions from electricity or embodied emissions of different components, and makes it available as visualization, a dashboard, and a technical interface (API) for further integration into other systems. Read the vision here →
IT and data center infrastructure is complex — If you are wondering about terms such as OT, DCIM, API or any other technical terms, use our Glossary.
Glossary →
Architecture
For the time being, the goal is to collect & aggregate data from the physical infrastructure (data center equipment, energy systems, building, servers, network) and provide it to the IT users to support better decision making on utilization, impact, timing, etc. Eventually the system will provide data bi-directionally also to the facility, but for now it’s directionally oriented towards the IT.
Core Components
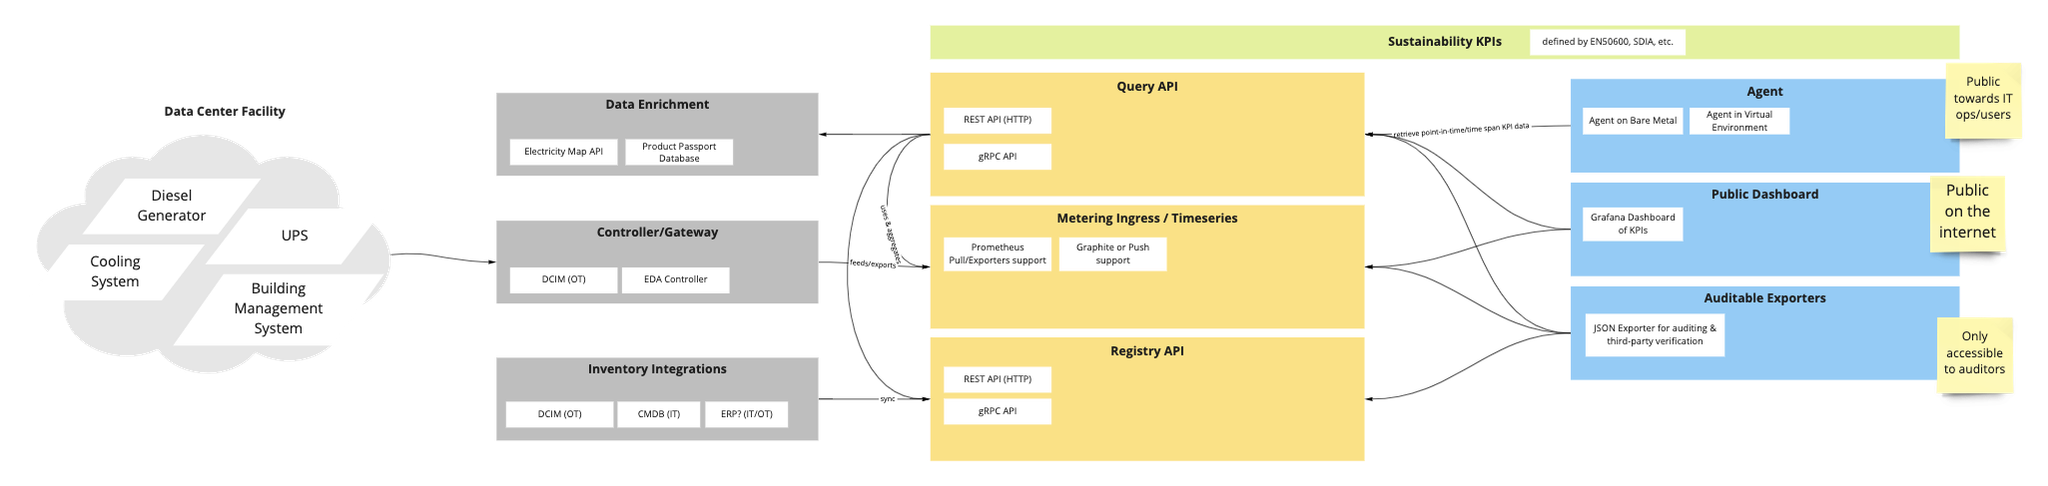
At its core the system consists of 3 primary functional units, which are listed below.
- A Registry of all equipment in the data center facility (OT) and of the IT infrastructure (network infrastructure, servers, etc.)
- A metering & sensor storage of time-series data that is received for each of the equipments in the Registry
- A Query API that uses third party sources as well as aggregation to generate insights on the key sustainability indicators as well as secondary insights that can be used to reduce the environmental impact within the IT
Data Sources & Integration
The primary aim of the data sources & integration is to be able to collect data from the equipment itself, and not rely on third-party sensors or manual data entry. Manual data entry should be avoided at all costs, as it reduced the verifiability, trustworthiness, accuracy and quality of the data.
The data sources are grouped into 3 groups:
- Enrichment data sources: Third-party APIs and databases used to enrich the aggregated data and provide improved insight. A good example is using the Electricity Map API to enhance power consumption data with emission factors or to provide forecasts on the expected emission-factor of the power grid over the course of the next hours.
- Other registries: Most IT owners and data center facility owners already have inventory systems in place that can be used to synchronize the list of equipment within the facility. Examples of such systems are DCIMs (OT) or CMDBs (IT) as well as ERP systems. Adapters are build to seamlessly synchronize the data to the Registry and avoid double-entry. The Registry also enables equipment, IT systems, etc. to self-register via an API.
- Gateway: Most facility equipment is communicating on industrial protocol such as modbus or SNMP or on the IT side via IPMI, TCP/IP etc. A gateway controller acts as the connectors, providing pull endpoints for Prometheus to ingest the metering data from all the equipment inside the facility. This is done in conjunction with the Registry, which is providing the ‘coordinates’ for each equipment. Not all data must flow through the Gateway, ingestion is also possible directly into the metering storage (e.g. if IT systems already have exporters configured).
User Interfaces
On the frontend-side, again 3 outputs are key to provide value to each stakeholder who needs to have access and insight into the sustainability performance indicators:
- IT Operations & Developers: Via an Agent that can be installed on Bare Metal systems as well as integrated into common virtualization and orchestration systems, the performance indicators provided by the Query API can be exposed to the developers, enabling them to improve the environmental performance of their applications.
- Public, policy & company CSR/sustainability: A publish dashboard that visualizes key sustainability indicators, creates transparency and insight into the environmental performance of the business.
- Policy, regulators: Auditable export interfaces will be needed to feed public registries as well as export data for third-party validation. The formats for those exports will likely be standardized (XML, JSON, Text files) and should be case-by-case based, e.g. an exporter can be build for each of regional, national or international requirements/standards.
A Data Aggregation, Enrichment & Dashboard for Digital Infrastructure focused on Key Performance Indicators for Sustainability
As the EDA is receiving data from across the entire the OT and IT infrastructure, it becomes possible to use this data to calculate most of the key sustainability indicators alongside with efficiency metrics.
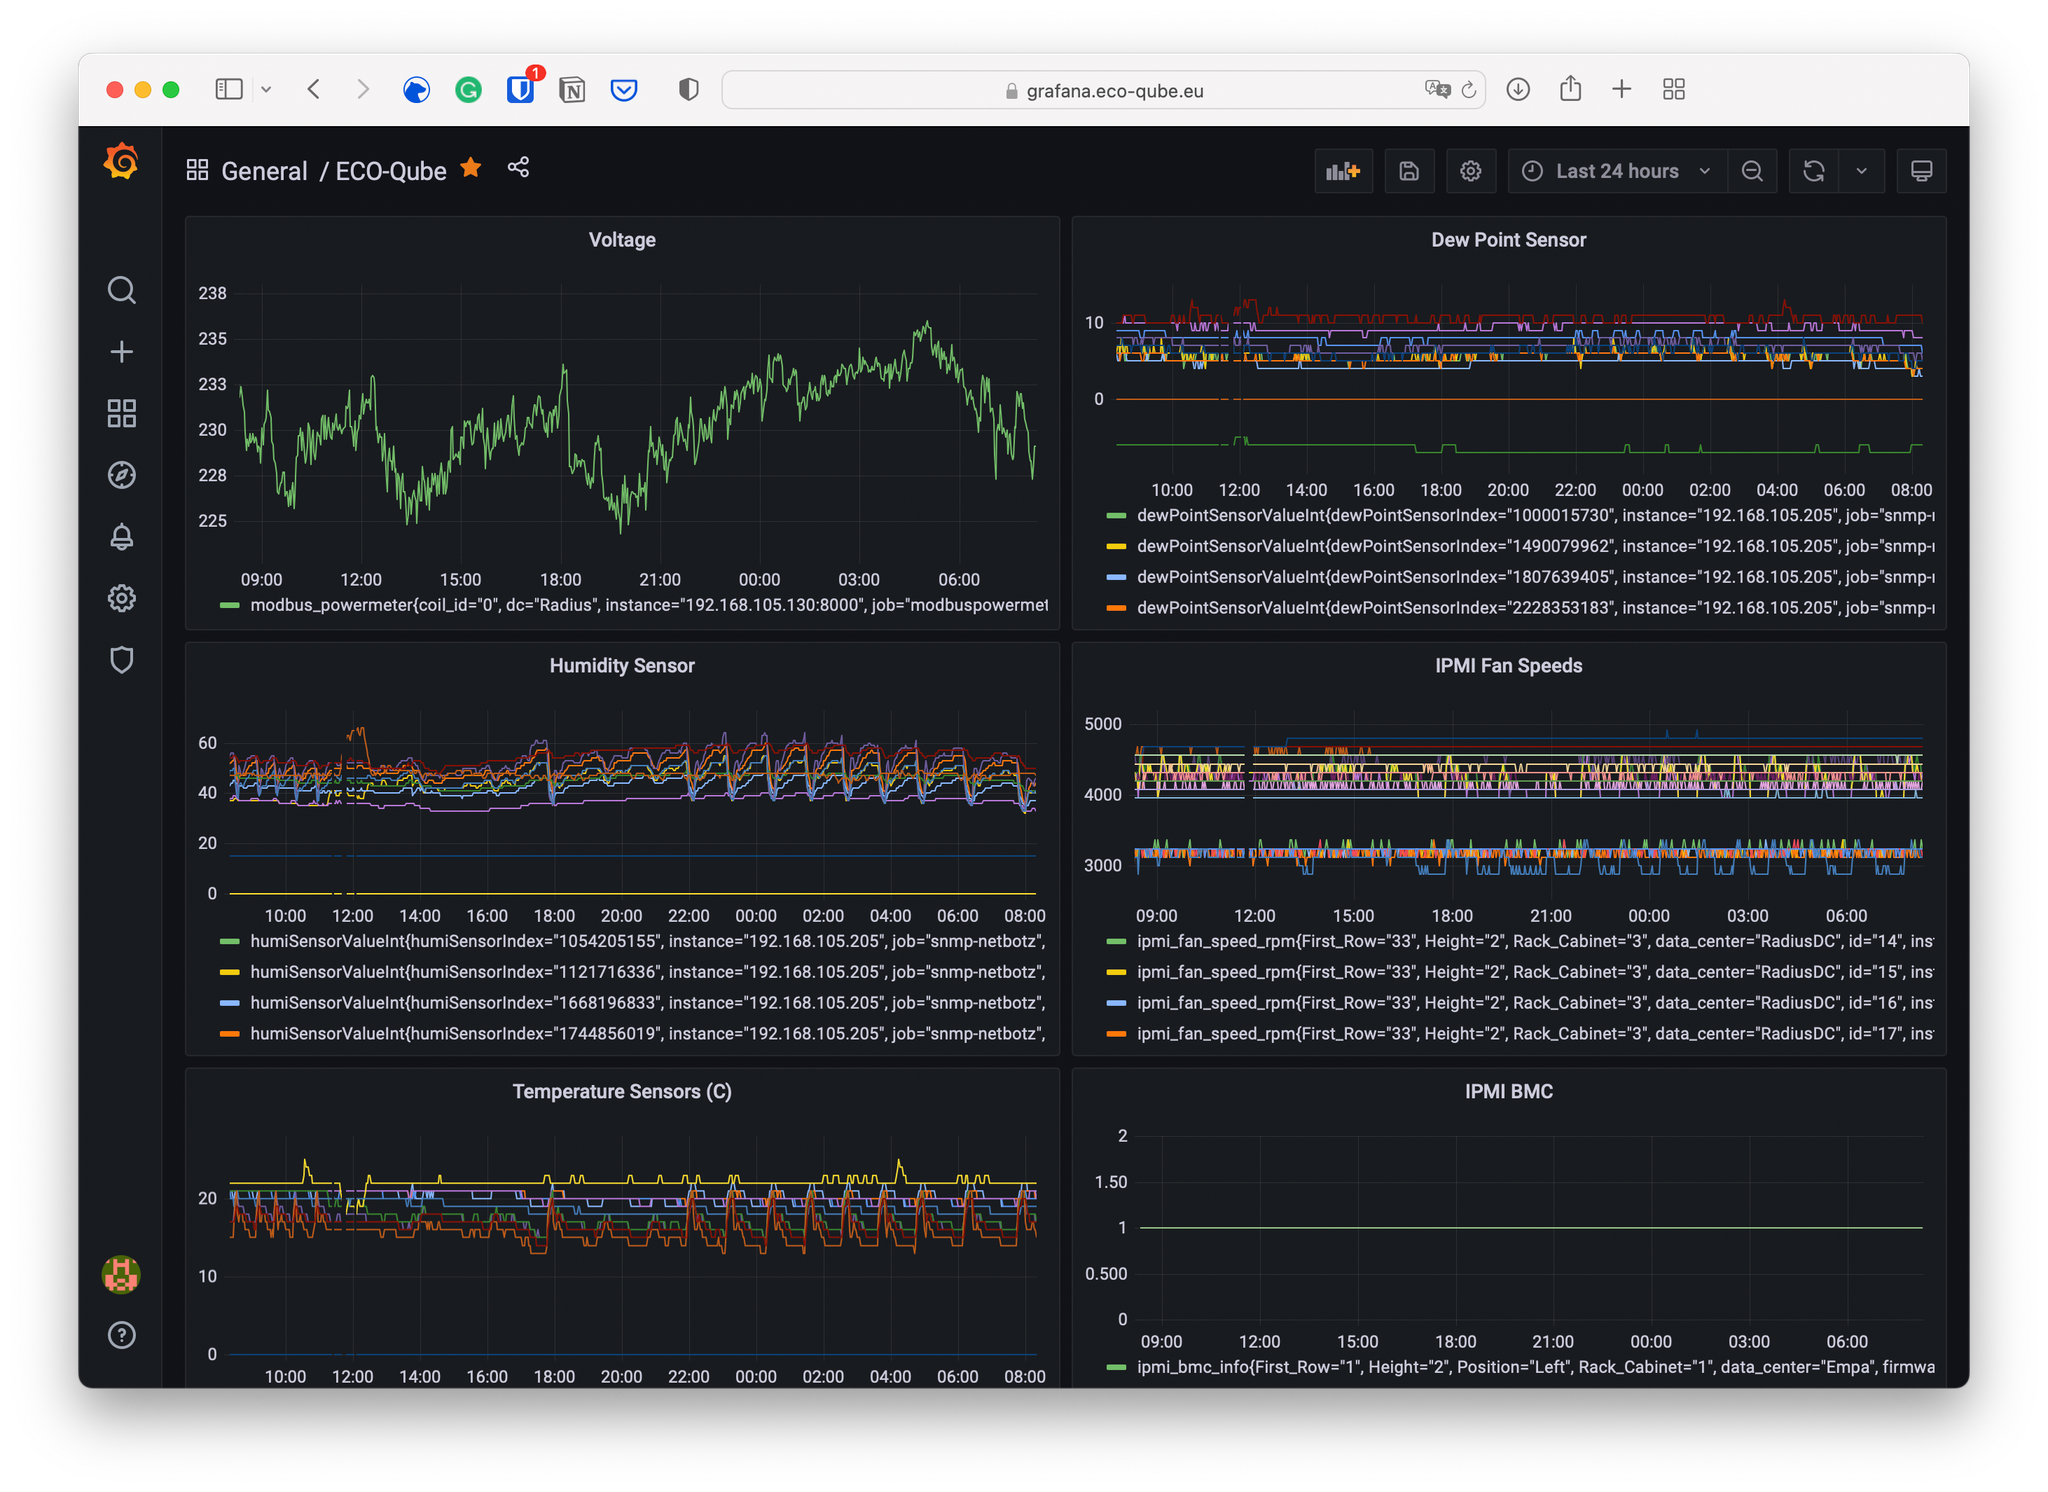
The EDA is designed to render three different dashboards (however, due to the use of Grafana, custom dashboards can be created):
- Sustainability Data (based on our data center scorecard)
- Efficiency Data (based on the metrics from the EN50600 and other standards, see our overview)
- Transparency Data (making information public - on business or environmental performance - available that is not included in the scorecard or metrics)
All of these dashboards support ‘zooming in and zooming out’ and can display information on facility, data hall, cage or rack-level.
These dashboards can be made public, can be made available only to customers, or can be used as an ESG reporting tool for investors. In addition to the visual display of the data, an API is provided that enables customers to receive their hall-, cage- or rack-specific information in a technical, standardized way, e.g. to integrate in their own reporting tools.
The data collected by the EDA is enriched using external or SDIA data sources:
- Embodied carbon and resource usage for data center equipment (UPS systems, rack, switch gear, cooling systems) is automatically determined from the SDIA Product Passport database (when available)
- Emission factor of the electricity for the location of the data center is provided by ElectricityMap.org
- Emissions and pollution from backup generators (depending on fuel type) are calculated automatically
- Embodied carbon & resource usage of IT hardware is provided by Boavizta API and SDIA Open Data Hub (if the facility owns the hardware)
- Embodied carbon & resource usage of network equipment is provided by SDIA Open Data Hub (if a product passport is available)
- Overhead calculations (e.g. office space, travel, and other Scope 1 & 2 data points) can be added manually
Further the EDA contains a database of fixed conversion factors, emission factors and calculation models that enable the conversion of physical observation data (e.g. electricity, water flow, etc.) into sustainability metrics (carbon, resource depletion, pollution) even if no external data is available (using static emission and conversion factors).
On-Site Deployment of the EDA
Enabling the sustainability dashboard does not require reporting or sending the data to an external server or Cloud service. The EDA can be deployed a dedicated server or controller which sits inside the actual digital infrastructure. This also allows granular configuration, e.g. if customer IT systems can access the information from inside the facility, or if the data should be delivered by an internal DCIM, or if the dashboard should be publicly accessible on the internet.
Existing DCIM are a data source
If there is an existing DCIM system in place at the data center facility, it can be used to report the relevant information to the EDA, where the enrichment and conversion of the data into sustainability metrics can be performed. DCIM’s can connect to the EDA API and register the equipment as well as provide the metrics through a Prometheus API that is part of the EDA.
Our Environmental Data Agent is open source. The API documentation shows how to register the equipment (inventory) of a facility. The measurements of the metrics are supplied via a Prometheus API.
See the documentation →
The EDA is a set of APIs that receive data from both IT and OT
This section is outdated and may be removed.
This repository contains (1) the methodology for calculating the environmental footprint (including carbon emissions) of server-side applications and (2) the API specification on how to expose the measured footprint as an API within IT infrastructure software. The specification is developed and governed by the Digital Carbon Footprint Steering Group (SG) of the SDIA.