
Data Center Metrics
Overview

Data Center
1.1 Energy consumption
1.1.1 Total energy consumption
Clearly, companies like to focus on efficiency metrics because it still allows a company to grow. The only problem is that with a growing economy, we need to reduce total emissions in order to fight climate change.
Therefore, it is important to, first of all, measure the total energy consumption of a data center before looking at its energy efficiency.
The total energy consumption (EDC) will be measured as the energy consumption of the supporting equipment (cooling, lighting, …) and the IT hardware.
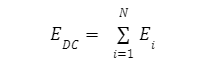
- N is the total number of energy consuming objects within the data center facility
- Ei is the amount of energy consumed by an object i
ISO/IEC 30134 and EN 50600-4-x series of standards state that in order to be able to measure total energy consumption the data centre under inspection needs to be viewed as a system defined by interfaces through which energy flows.
It also defines which forms of energy have to be metered at the interfaces:
- electricity;
- gaseous fuel;
- fluid fuel;
- fluids for cooling (comprising water usage when returned fluid and not evaporated).
And which forms of energy are not required be metered at the interfaces:
- air for cooling;
- water from natural sources (i.e. requiring no energy consumption in its provision).
For the KPI of the ISO/IEC 30134 and EN 50600-4-x series to be meaningful it is important to keep the system boundaries of a Data Centre fixed and to use total energy consumption in a consistent manner.
1.1.2 Share of renewables (REF/ OEF)
When calculating the environmental impact of a data center, one needs to take into account that some facilities do not only get their energy from the grid but produce it directly on site.
With On-site renewable power generation, the total carbon footprint of a data center reduces by the percentage of energy that comes from renewables.
We identified two metrics that measure the share of renewable energy, the Renewable Energy Factor (REF) and the On-site Energy Fraction (OEF).
Comment: It would be great to not only ask for the share of renewables, but also where the DC consumes power in order to get more insight on the overall grid (i.e. also non-renewables).
The REF is defined in ISO/IEC 30134-3 / EN 50600-4-3 and describes the percentage of renewable energy over the total data center energy.
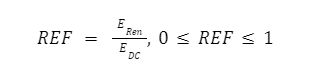
- ERen represents the total amount of energy coming from renewables in kWh
- EDC represents the total amount of energy consumed by the data center in kWh
The OEF sets the share of renewables used in the procurement of energy in relation to on-site energy production. While the carbon intensity of the local energy grid fluctuates and cannot be influenced by the data center, data centers with on-site energy production have a source of 100% renewable energy. The OEF calculates how much of the required power is facilitated by the on-site renewables. Ideally, the renewables cover 100% of the load power that the data center consumes which would equal a OEF value of 1.
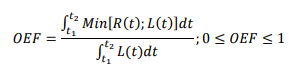
- R(t) represents the renewable power produced at time t
- L(t) is the load power consumed at time t
- dt represents the time period of the calculation
Comment: Maybe this is already taken into account, but what about the back-up generators? How much energy do they use e.g. per year and what is their source of energy?
1.1.3 Power Usage Effectiveness (PUE) / Total Energy Usage Effectiveness (TUE)
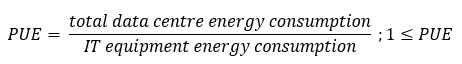
PUE is the most well-known data center efficiency metric at the moment and is defined in ISO/IEC 30134-2 / EN 50600-4-2 . It calculates the total energy consumption by the facility in relation to the energy that goes into the IT.
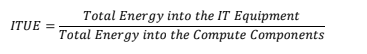
1.1.4 ITUE
However, although being the most popular metric in terms of energy efficiency, PUE does not represent the efficiency of the actual IT. To take this into account, Intel has developed the ITUE metric, adding one layer of detail to the energy consumption of the IT Equipment. The ITUE is a PUE-type metric for the IT equipment rather than for the data center. Just like the PUE, it will split up the total energy consumption of the IT equipment into supporting and computing activities and calculate a ratio between the total IT power and the compute power.
To combine this metric with the overall efficiency of the facility and consequently get an overall metric of the data center efficiency, the ITUE can be multiplied by the PUE.
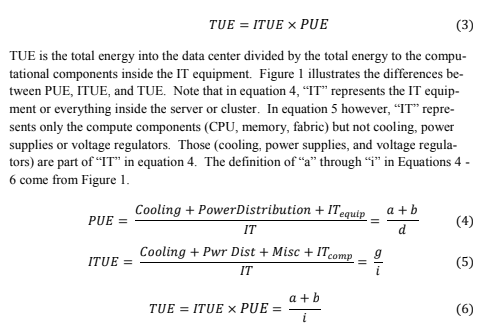
Source: Patterson et al. (2011)
1.1.5 Energy reuse factor (ERF) / Energy reuse effectiveness (ERE)
Apart from primary energy consumption, some data centers reuse their energy for different purposes, creating a secondary energy consumption opportunity.
Comment: Potentially very nice if energy is actually reused, but this can also be easily used for greenwashing. How can we prevent companies from 'subtracting' a portion of their total consumption that 'can be reused' but is in reality lost to the environment?
The ERF is defined in ISO/IEC 30134-6 / EN 50600-4-6 determines the share of the total energy consumption that is reused.
Energy reuse effectiveness - which is not part of the standard - can be calculated from PUE multiplied and Energy Reuse Factor.
1.1.6 Cooling efficiency ratio
Due to the fact that cooling takes a considerably high share of the total energy consumption, it is reasonable to include a cooling efficiency metric. In recent years, the Cooling Efficiency Ratio (CER) has emerged to be the most popular efficiency metric when it comes to cooling operations within a data center and is defined in ISO/IEC 30134-7 / EN 50600-4-7. It calculates the ratio of the amount of heat removed and the energy consumption by the cooling system.
- Q(removed) is the amount of heat removed from the data center in kWh per year
- E(cooling) is the amount of energy that has been consumed by the cooling system in kWh per year
It is important to note that this metric does not calculate a comparable equipment specific efficiency value. The same cooling system can lead to different CER values depending on the specific data center it is installed in. The metric only gives an indication of how efficient the cooling system operates in this specific data center and should be used as an internal KPI to measure improvements.
1.2 Carbon Emissions
Once the energy data has been collected, we can derive the carbon emissions from that number by using carbon intensity information of local energy grids.
1.2.1 Carbon intensity of total energy consumption
Again, to quantify the total emissions unrelated to efficiency, we measure the total carbon emissions from the data center. Therefore, we will take the total energy consumption of chapter 1.1.1 and multiply it by (1- OEF ( On-site energy fraction ) ) to get the total energy consumption that comes from the energy grid. Additionally, we reduce this number by the amount of energy that is being reused within the facility.
With this calculation we get the net energy consumption of a data center that is fed in by the grid. We then multiply this number by the CO2-equivalent of the local energy grid which is generally available within 24 hours after the actual energy consumption. We then add the CO2- Emissions of the back up generator in case it is running on fossil fuels.
Comment: need a flow chart for all routes to get to this number
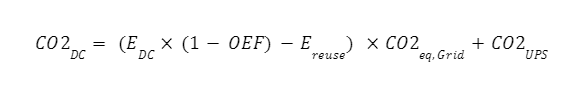
- CO2DC is the carbon emissions of the data center in kg
- EDC is the total energy consumption of the data center in kWh
- OEF is the On-site energy fraction
- Ereuse is the energy that is being reused in kWh
- CO2eq, Grid is the carbon intensity of the local energy grid in kg/kWh
- CO2UPS is the carbon emissions of the back up generator
1.2.2 Carbon emission factor (CEF)
From the above data, we can also calculate the carbon emission factor. For this metric, the total carbon emissions get divided by the total energy consumption. Effectively, this metric will return the carbon intensity of the grid, so it needs to be discussed if we will implement it.
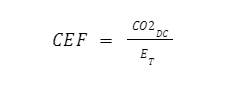
- CO2DC is the total amount of carbon emissions by the data center in kg
- ET is the total energy consumed by the data center in kWh
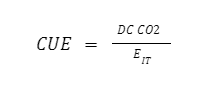
1.2.3 Carbon Usage Effectiveness (CUE)
Carbon Usage Effectiveness (CUE) is described in ISO/IEC 30134-8 / EN 50600-4-8. The document is not yet published and is expected for 2022.
The draft proposes 3 categories to assess and report carbon emissions:
- Category 1 (basic): accounting of external and internal DC electricity, reported in CO2 emissions
- Category 2 (intermediate): accounting of external and internal DC electricity, all additional DC energy supply and all additional DC emission sources, reported in CO2 equivalents
- Category 3 (advanced): reserved for future use
IT Hardware
2.1 Energy consumption
The total energy consumption of the hardware can already be delivered by the data center facility owner. However, to get more detailed information on the relationship between energy consumption and IT performance. The following metrics can be calculated once the data on the IT hardware is collected.
2.1.1 Energy consumed by hardware components (Idling vs working)
For this comparison between the idling and working energy consumption we can take the data from the data center operator on hardware energy consumption and combine it with the data from the hardware owner on utilization.
We will get one absolute energy consumption number for the idling and working state in kWh per hour.
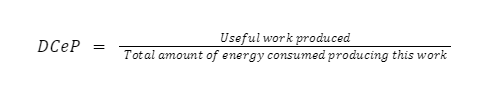
2.1.2 Amount of useful energy consumed (Data center energy productivity )
After identifying the energy consumption of the working vs the idling state, it is important to define how efficient the hardware is operating.
To define the productivity of the hardware, we can look at the share of useful work and compare it with the total energy consumption.
In this case, it is important not to look at utilization rates as an indicator of productivity.
The Green Grid stated:
“There is no clear definition of utilization that works for all IT equipment in all applications. It can be assumed for servers that what is intended for utilization is actually CPU utilization, but as described in the cited paper, it remains merely conceptual. Using CPU utilization as a proxy for the normalized amount of useful work a server produces, however, does not account for processing overhead which produces no useful work. It also does not adequately account for I/O intensive workloads where the CPU is essentially idle waiting for I/O requests to complete”
For more information on the definition of useful work, please read this paper.
2.1.3 Server energy productivity (% Energy consumption / % of compute work done)
The server energy productivity (SEP) is a metric that we developed which compares the energy consumption of a server in relation to the share of compute work the server is doing. This metric aims to identify servers that need to be replaced because of a high energy consumption or a low contribution to the compute work.
- SEDi is the server energy productivity of server i
- Ei is the share of energy consumption of server i in % (compared to total energy consumption of servers
- Ci is the share of compute work of the server i in % (compared to total compute work done by all servers)
Comment: his point gives an opportunity to give some hint of how SEP compares to CO2eq from production of a new server, therefore, 'when does it make sense from the CO2eq point of view to replace servers?'
2.1.4 Server energy effectiveness metric
ISO/IEC 21836 defines a metric to measure the energy effectiveness of servers. It is based on SPEC SERT™v2 (https://www.spec.org/sert2/SERTmetric.pdf) and defines the conditions under which the effectiveness of servers can be rated. SERT™ uses worklets for CPU, memory and storage to measure the server's capabilities to run the worklets and its energy use to do so. SERT™ defines the conditions to carry out the measurements and the way how to publish the results.
ISO/IEC 21836 also allows implementer specific metrics thus making it difficult to compare servers.
A similar approach is undertaken by the European standard ETSI EN 303 470 (https://www.etsi.org/deliver/etsi_en/303400_303499/303470/01.01.00_30/en_303470v010100v.pdf). The metric for active state is:
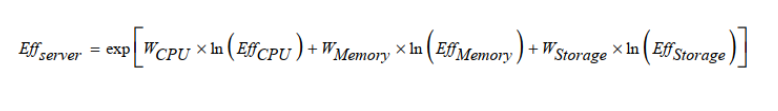
where WCPU, WMemory and WStorage are the weightings applied to the CPU, Memory and Storage worklets respectively. While the weightings are not defined in ISO/IEC 21836, ETSI EN 303 470 defines the weightings as follows:
- WCPU = 0,65
- WMemory = 0,30
- WStorage = 0,05
With this approach every server under inspection is characterized by a number for Effserver and can be compared to other servers.
ETSI EN 303 470 also defines an idle state metric: Idle power is the alternating current (a.c.) power of the device with no activity either before or after running the SERT™ worklets. Two methods of measurement are possible:
- manual collection of the idle power data from the power meter;
- the SERT™ test automatically records and reports the idle power value.
EU Eco-design directive for servers and storage
The European Commission's EU Eco-design directive for servers and storage1 defines minimum values for the efficiency of servers in active state and in idle state. The definition is the same as in ETSI EN 303 470 with the same weighting for the worklets in active state.
The Eco-design directive mandates every supplier bringing components into the European market to achieve the values and to state the values to the customer. These values enable comparison and procurement of energy efficient servers when used in the decision making process.
2.1.5 IT equipment energy utilization for servers (ITEUsv)
ISO/IEC 30134-5:
ITEUsv describes the utilization of the server equipment in the DC in operational conditions. ITEUsv is developed with the knowledge that server energy efficiency tends to be optimal with higher utilization level. ITEUsv accounts for utilization (the amount of time the server is actually doing work) and power management (the ability of the server to reduce the energy consumption when the server is not fully loaded) aspects.
- ITEUsv(t) is the average Central Processing Unit (CPU) utilization of all servers or a group of servers in a DC at time t.
- It corresponds to the sum of the CUSi(t) divided by N, with:
- CUSi(t): CPU utilization ratio of server i at time t, measured by a performance monitoring tool provided by a server operating system
- N: the number of servers in a DC or in a group running at time t
- When some servers are working at very low load, a DC owner/operator can improve ITEUsv(t) by reducing the number of operating servers with virtualization techniques, while maintaining the whole workload of the C.
- If a DC owner/operator utilizes server “power OFF” function to save energy consumption of servers in idle state, ITEUsv(t) shall be calculated by subtracting servers at “power OFF” state.
- The ITEUsv(t) value is high when most servers are running at high utilization status at time t.
- ITEUsv indicates average CPU utilization in a year for all servers or a group of servers.
- The DC shall monitor ITEUsv(t) for a year and collect all data. The DC shall then calculate the annual average of ITEUsv(t), which is the ITEUsv.
- The interval of measurement shall be between 1 min and 1 h. The DC shall decide the interval based upon server operating conditions.
- In case the measurement is made in a partial section of the DC or a group of servers in a DC, then the measured area shall be stated. This group shall be identical and designated to a measurement group of ITEEsv. ITEUsv shall not be summed among these groups. When there is no CPU monitoring tool applicable to some servers, these servers shall not be included in these groups.
- During the measurement, the maximum value of ITEUsv(t) and its time shall be recorded. The maximum value of ITEUsv(t), or peak ITEUsv(t), is useful to set a target value of ITEUsv
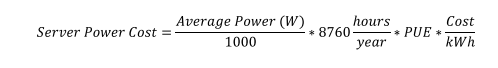
2.4 Cost of digital power
2.4.1 Server power cost
2.4.1 Efficiency of hardware
Needs to be discussed - how does the cost of digital power relate to energy efficiency of hardware and how to measure it
- Bops/kWh
- COMMISSION REGULATION (EU) 2019/424 of 15 March 2019 laying down ecodesign requirements for servers and data storage products pursuant to Directive 2009/125/EC of the European Parliament and of the Council and amending Commission Regulation (EU) No 617/2013↩